Marine Atlantic
Marine Atlantic corporate information
Budget 2024 provided Marine Atlantic funding to support fares and continue operations of $124.1M over five years.
When Newfoundland joined Canada in 1949, the ferry service between the Province of Newfoundland and Labrador and the mainland was accorded special constitutional status under Term 32(1) of the Terms of Union (The Newfoundland Act, 1949) which guarantees that Canada will “maintain in accordance with the traffic offering a freight and passenger steamship service between North Sydney and Port aux Basques, which, on completion of a motor highway between Corner Brook and Port aux Basques, will include suitable provision for the carriage of motor vehicles.
Acts governing Marine Atlantic:
- Financial Administration Act
- Marine Atlantic Inc. Acquisition Authorization Act
- National Marine Policy requires that Marine Atlantic focus its efforts on operating the gulf ferry service.
- Articles of Incorporation
- By-laws
- Vision, mission statement, and values, further direct both the Board and management in their decision- making.
Revenue
| Revenue Source x 1000 | 2022-23 | 2019-20 |
|---|---|---|
| Transportation revenue | 109,597 | 96,568 |
| Fuel surcharge revenue | 9,905 | 11,650 |
| Other income | 421 | 229 |
| Foreign currency exchange gain | 295 | |
| Realized gain on derivative financial instruments | 12,101 | |
| Total Revenue | 132,319 | 105,625 |
| Operations Subsidy | 90,948 | 83,239 |
| Capital Subsidy | 40,880 | 50,076 |
| Total Subsidy | 130,200 | 133,315 |
- Total Expenses 332,710
- Cost recovery: 59.9% in 2023
Traffic
| Traffic | 2022-23 | 2019-20 |
|---|---|---|
| Passengers | 360,388 | 311,499 |
| Passenger vehicles | 142,645 | 120,426 |
| Commercial vehicles | 92,687 | 82,194 |
| Auto Equivalent Units | 538,289 | 470,095 |
| Number of single crossings | 1,750 | 1,632 |
- 86% On-Time Performance
Board of Directors (10)
- The independent directors are chosen and appointed for specific terms by the Government of Canada.
- The President and CEO is also a member of the Board
| Board member | Committee |
|---|---|
| Gary O’Brien | Chair |
| Murray Hupman | Ex-officio |
| Carla Arsenault | Innovation and infrastructure |
| Janie Bussey K.C. | Chair HR |
| John Butler | HR |
| John B. Chaffey | Finance |
| Owen Fitzgerald | Finance |
| Lynn Kendall | HR |
| Craig Priddle CPA | Finance |
| Ann-Margaret White | Finance |
Regular Shipping to Newfoundland
-
Marine Atlantic (4 mixed use ferries)
- Cape Breton, NS
- Port aux Basques
- Argentia
- year-round 96 nautical mile daily ferry service between Port aux Basques and North Sydney
- seasonal 280 nautical mile ferry service between Argentia and North Sydney
MSC Mediterranean Shipping Company
-
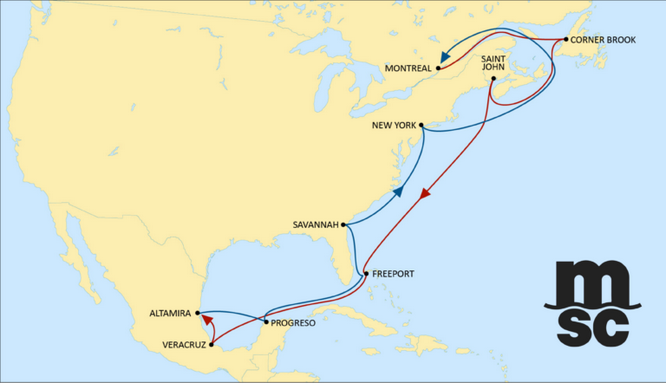
MSC (5 container ships)
- Started in May 2020.
- From Montreal
- Corner Brook Port
- Canada Gulf Bridge Service currently runs weekly out of the Port of Corner Brook
- MSC is the only international ocean carrier providing access to and from Asian and South American markets directly linked to Newfoundland.
Ships include:
- MSC DON GIOVANNI/CG417A
- MSC BALTIC III/CG418A
- MSC MALENA/CG419A
- MSC SAMIRA III/CG420A
- MSC ALDEBARAN III/CG421A
Oceanex
-
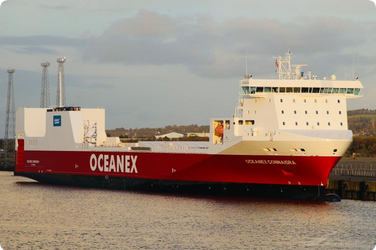
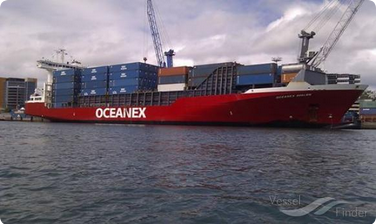
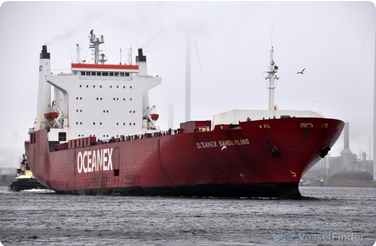
Oceanex (3 cargo ships)
- From Montreal
- St. John's
- Ships about 75 per cent of all freight destined for St. John’s.
- Ships half of all freight headed for Newfoundland.
- Oceanex's main publicly stated concern is with the subsidy regime supporting Marine Atlantic (the fact that it operates as a non-profit, subsidized Crown).
- Oceanex considered shutting-down service to Newfoundland during the pandemic. Marine Atlantic stated that it would, somehow, be able to replace the lost shipping traffic.
Ships include:
Other
- Other regular shippers exist, but are not focused on shipping dry cargo from the mainland.
-
There are regular shipping routes that come in from Labrador and Saint Pierre and Miquelon which bring cargo that is enroute from other locations to Fortune, NL.
- Labrador main dock: Terrington Basin, Happy Valley – Goose Bay, NL
- Operated by Nunatsiavut Marine Inc. and Labrador Marine Inc.
- Passenger and freight services.
- There are irregular cargo transports arriving in different NL ports throughout the year, but these shipments make-up a small portion of the shipments of goods to NL. They are, however, essential routes for trade.
NL Intra-provincial marine transport
- Newfoundland and Labrador counts an intra-provincial ferry fleet to its 35+ points of call.
-
Annual transport on all ferries:
- 820,000 passengers
- 400,000 vehicles
- 12,000 tonnes of freight
- Provides access to 11,000 residents of remote and isolated communities.
- NL Marine Services provides freight between communities.
Marine Atlantic ships
Marine Atlantic claimed that they could accommodate all of Oceanex’s cargo shipping if they were to pull out of NL shipping, a rather strange position since stuff shipped from Montreal is different from stuff shipped from Cape Breton.
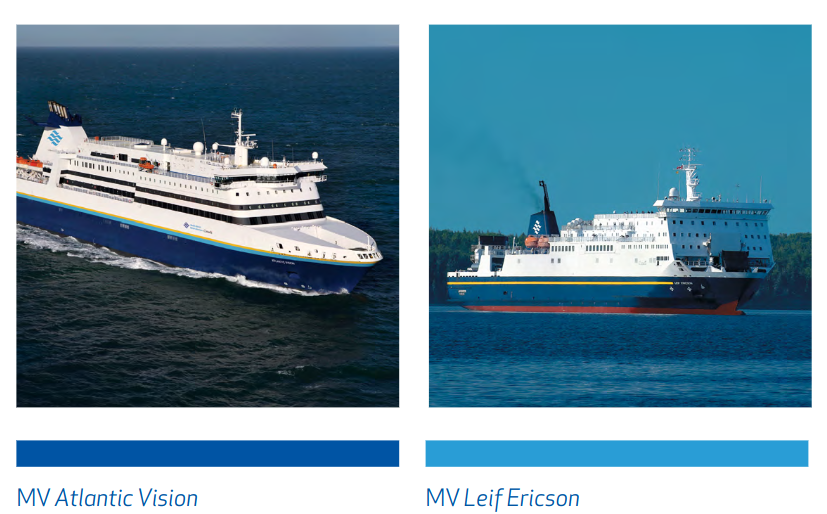
Leif Ericson
- 300 Commercial vehicles: automobiles and tractor trailers
- 500 passengers: drivers of the commercial vehicles
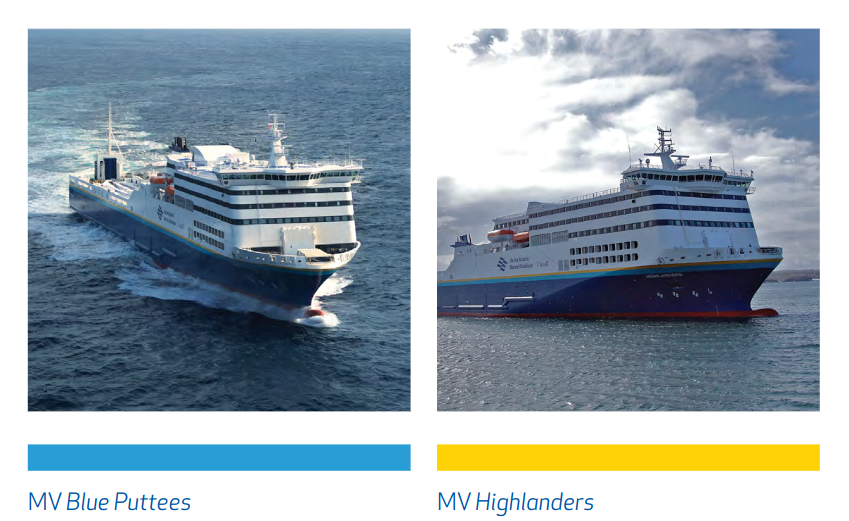
MV Blue Puttees
- 1000 passengers
- 425 cars, 177 trailers, or 90 tractor trailers
MV Highlanders
- 1000 passengers
- 425 cars, 177 trailers, or 90 tractor trailers
Atlantic Vision
- Out of service, currently in dry dock in Denmark
- 700 passengers
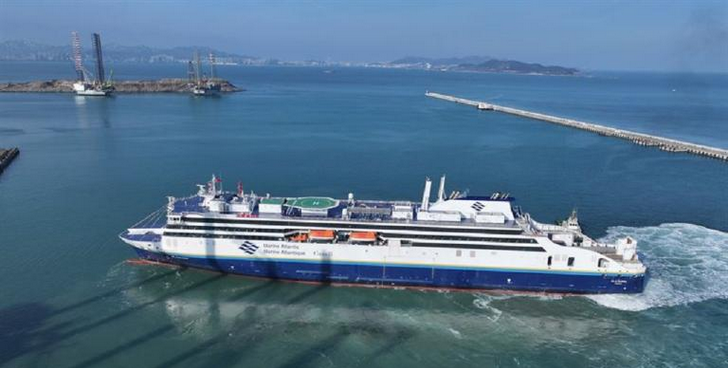
Ala'suinu
- Comes online in 2024-2025, currently in North Sydney, Nova Scotia.
- Will replace Atlantic Vision
- 1000 passengers
- ~450 cars or equivalent
Pictures
Wages
Agreement C
| 4.50% | |
|---|---|
| Classification | 1-Jan-22 |
| Foreperson | 37.815 |
| Tradesperson Foreperson | 37.815 |
| Lead Hand | 38.106 |
| Journeyman Carpenter | 35.764 |
| Carpenter | 33.949 |
| Machine Operator | 35.764 |
| Painter | 32.293 |
| Rough Carpenter | 30.647 |
| Tradesperson | 35.155 |
| Pipefitter | 35.764 |
| Plumber | 35.764 |
| Machinist | 35.764 |
| Electricians and Maintainers | 35.764 |
| Ramp Operators | 31.118 |
Agreement B
| Classifications | 1-Jan-22 | 1-Jan-22 |
|---|---|---|
| Local 4285 | Hourly | Monthly |
| Engine Room Storekeeper | $31.837 | $5539.64 |
| Chief Cook | $31.837 | $5539.64 |
| Chief Storekeeper | $31.837 | $5539.64 |
| Bosun | $31.185 | $5426.19 |
| Carpenter | $31.185 | $5426.19 |
| Quartermaster | $31.185 | $5426.19 |
| 2nd Cook | $30.087 | $5235.14 |
| Steward-Newsstand | $30.087 | $5235.14 |
| Deckhand/Bridgewatch | $30.087 | $5235.14 |
| AB Deckhand | $30.087 | $5235.14 |
| Certified Engine Room Assistant | $30.087 | $5235.14 |
| Engine Room Assistant (Grandfathered) | $29.954 | $5212.00 |
| Engine Room Assistant (Uncertified) | $29.370 | $5110.38 |
| Ordinary Deckhand | $29.370 | $5110.38 |
| Asst Storekeeper | $29.954 | $5212.00 |
| Bar Steward | $29.237 | $5087.24 |
| Assistant Steward | $29.237 | $5087.24 |
| Bilingual Steward | $29.237 | $5087.24 |
| Local 4286 | ||
| Senior Chief Steward | $37.100 | $6455.40 |
| Purser | $35.345 | $6150.03 |
| Chief Steward | $35.345 | $6150.03 |
| Senior Chief Cook | $35.345 | $6150.03 |
| Liferaft | ||
| Liferaft Maintainer Uncertified** | $30.087 | $5235.14 |
| Liferaft Maintainer Uncertified* | $31.264 | $5439.94 |
| Liferaft Maintainer Certified | $32.584 | $5669.62 |
2023 Canada Job Board Hourly Wages
These are wages reported on the Canada Job Board. Usually, these are reported wage rates for private sector non-union jobs, but sometimes report union positions.
We would compare to the Max wage rate, but should give us some comparisons to what is being posted on job boards.
Avalon Peninsula Region
| Classification | Max ($) | Ave ($) | nocnum |
|---|---|---|---|
| Chefs | 30 | 22.4 | 62200 |
| Cooks | 24.5 | 17.51 | 63200 |
| Machinists and machining and tooling inspectors | 38 | 27.51 | 72100 |
| Welders and related machine operators | 52 | 33.72 | 72106 |
| Electricians (except industrial and power system) | 41 | 30.39 | 72200 |
| Industrial electricians | 45.67 | 33.56 | 72201 |
| Plumbers | 34.77 | 28.8 | 72300 |
| Steamfitters, pipefitters and sprinkler system installers | 48 | 39.37 | 72301 |
| Carpenters | 35.33 | 26.37 | 72310 |
| Deck officers, water transport | 66.75 | 43.05 | 72602 |
| Engineer officers, water transport | 66.82 | 46.9 | 72603 |
| Painters and decorators (except interior decorators) | 28 | 21.55 | 73112 |
| Water transport deck and engine room crew | 57.69 | 30.72 | 74201 |
| Machine operators, mineral and metal processing | 45.63 | 94100 | |
| Process control and machine operators | 50 | 25.45 | 94140 |
| Industrial painters, coaters and metal finishing | 41.25 | 29.84 | 94213 |
Across All Newfoundland
| Classification | Max ($) | Ave ($) | nocnum |
|---|---|---|---|
| Storekeepers and partspersons | 31.6 | 23.43 | 14401 |
| Chefs | 30 | 21.75 | 62200 |
| Cooks | 25 | 18.07 | 63200 |
| Ticket agents/ cargo service, related clerks | 28.55 | 20.04 | 64313 |
| Machinists and machining and tooling inspectors | 34 | 25.95 | 72100 |
| Welders and related machine operators | 54 | 38.84 | 72106 |
| Electricians (except industrial and power system) | 40 | 29.4 | 72200 |
| Industrial electricians | 50.53 | 37.84 | 72201 |
| Plumbers | 39 | 29.09 | 72300 |
| Steamfitters, pipefitters and sprinkler system installers | 48 | 38.95 | 72301 |
| Carpenters | 36 | 25.87 | 72310 |
| Other small engine and small equipment repairers | 25 | 19.58 | 72429 |
| Deck officers, water transport | 66.75 | 42.01 | 72602 |
| Engineer officers, water transport | 65 | 45.57 | 72603 |
| Painters and decorators (except interior decorators) | 30 | 22.3 | 73112 |
| Water transport deck and engine room crew | 43.27 | 27.66 | 74201 |
| Fishing vessel deckhands | 100 | 42.32 | 84121 |
| Process control and machine operators | 50 | 24.93 | 94140 |
| Industrial painters, coaters and metal finishing | 57 | 34.82 | 94213 |
Bay Ferries
| Classification | June 1, 2021 |
|---|---|
| 4004.22 | |
| Customer Service Supervisor | $24.10 |
| Customer Service Associate | $22.96 |
| Night Watchperson | $22.96 |
| Maintenance Staff | $23.76 |
| 4404 | 01-Apr-2021 |
| Watchkeeping Engineer | 33.83 |
| Electrical Officer | 33.83 |
| Senior Engineer (2 positions) | 36.63 |
| Passenger Services Supervisor | 25.21 |
BC Ferries Wages
BCFMWU Admin Unit
COPE Ministrative Unit
| Classification | Feb 1, 2023 | Feb 1, 2024 | Feb 1, 2025 |
|---|---|---|---|
| Administrative Coordinator | 40.8 | 41.62 | 42.45 |
| Accounting Clerk | 38.18 | 38.94 | 39.72 |
| Administrative Assistant | 34.99 | 35.69 | 36.4 |
| Accounts Payable/ Payroll Clerk | 36.58 | 37.31 | 38.06 |
| Receptionist/Administrative Asst. | 31.56 | 32.19 | 32.83 |
| Probationary Receptionist/Administrative Asst. | 30.52 | 31.18 | 31.76 |
Newfoundland Travel, Shipping, and Economy
Question: How have things changed since 2000?
NL Wealth
The total net worth has increased over 200% over the 20 year period 1999 to 2019. In that time, total average earnings of the average Newfoundland family increased by over 100%.
This growth in total wealth and wage earnings far outstrips increases in prices during that period.
Even including the high inflation period since 2019, growth in incomes and wealth of the Newfoundland family has gained around 50% faster than prices since 1999.
- 202% Growth in Total Net Worth of Newfoundland families 1999 to 2019.
- 48.5% Growth in prices 1999 to 2019
- 105% Growth in Average Earnings of Newfoundland families 1999 to 2024.
- 69.5% Growth in prices 1999 to 2023
However, growth of the average blue collar workers continues to fall behind the growth rate of those at the top of Newfoundland's wage grid. Only through collective bargaining are the workers at the lower end of the economic scale able to restore balance.
_Total_net_worth_1st_quintile_2nd_quintile_Middle_quintile_4th_quintile_5th_quintile_chartbuilder.png)
NL government reports also show this income disparity.
"nearly half of residents reported that their household finances are worse or much worse off, with those residents aged 35-54 significantly more likely to indicate that their household finances are much worse off"
This is compared with 55% of residents who have had no change or are better off in their finances.
According to the NL government travel survey, while the main issue affecting travel plans is inflation and the costs associated with travel, Newfoundlanders are returning to pre-pandemic travel patterns. And, only 1/3rd of trips are to visit family.
The average Newfoundland traveller is willing to spend much more on vacations now.
In 2022, residents planned on spending:
- vacation trips: $710
- visiting family: $428
- quick "getaway" trip: $510
The cost increases experienced by regular working Newfoundlanders should not (and cannot) be paid for through wage suppression of Marine Atlantic workers. Prices for transport of goods and people already do not reflect the true cost of transportation on Marine Atlantic.
Government subsidies for Marine Atlantic are to regulate the price of transport of goods, but subsidies should be paid for by all Canadians, not through lower wages for Marine Atlantic workers. Competitive wages for workers at Marine Atlantic are essential to maintain the quality of service expected on our ferries.
Access to personal transport options
Travel to and from the island in 2023
Tourists by sector of travel:
- 304,300 air visitors
- 113,600 auto car visitors
- 69,100 cruise ship visitors
Total travel by sector:
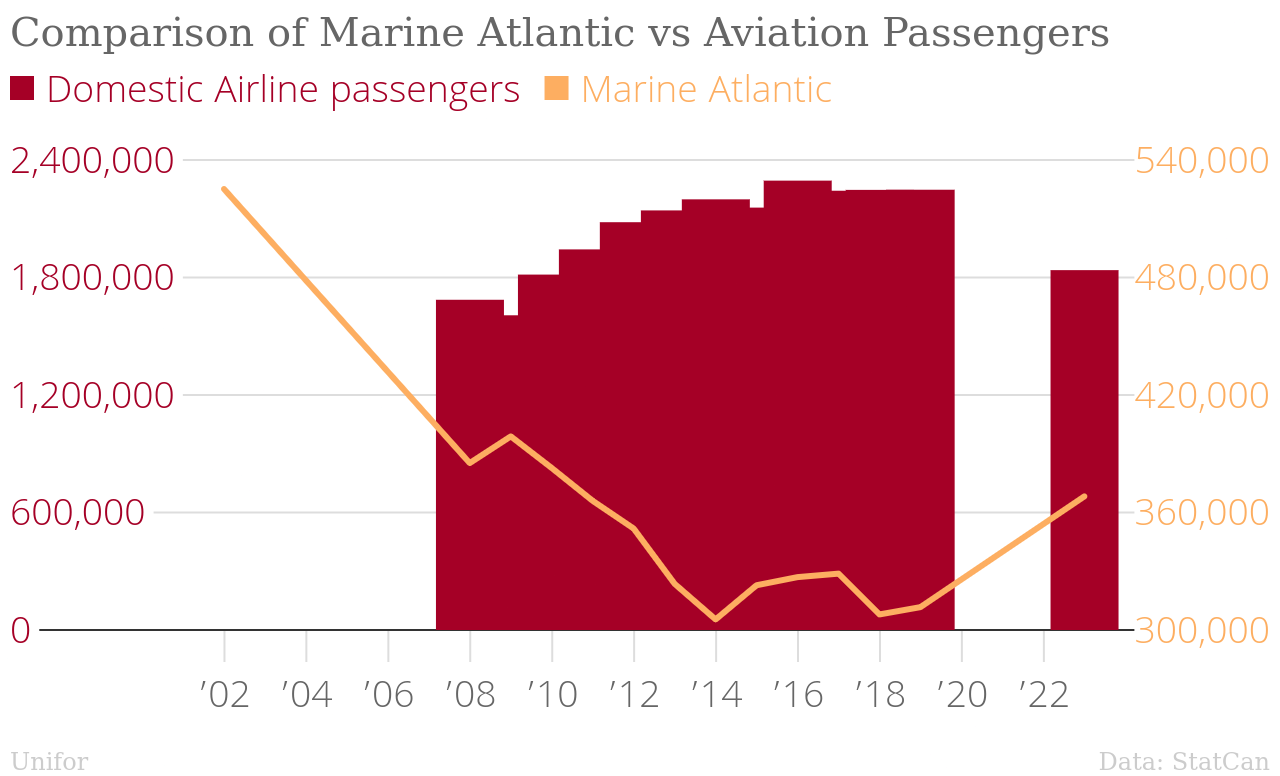
- 1,837,629 passengers by air
- 368,039 passengers on Marine Atlantic
Air travel
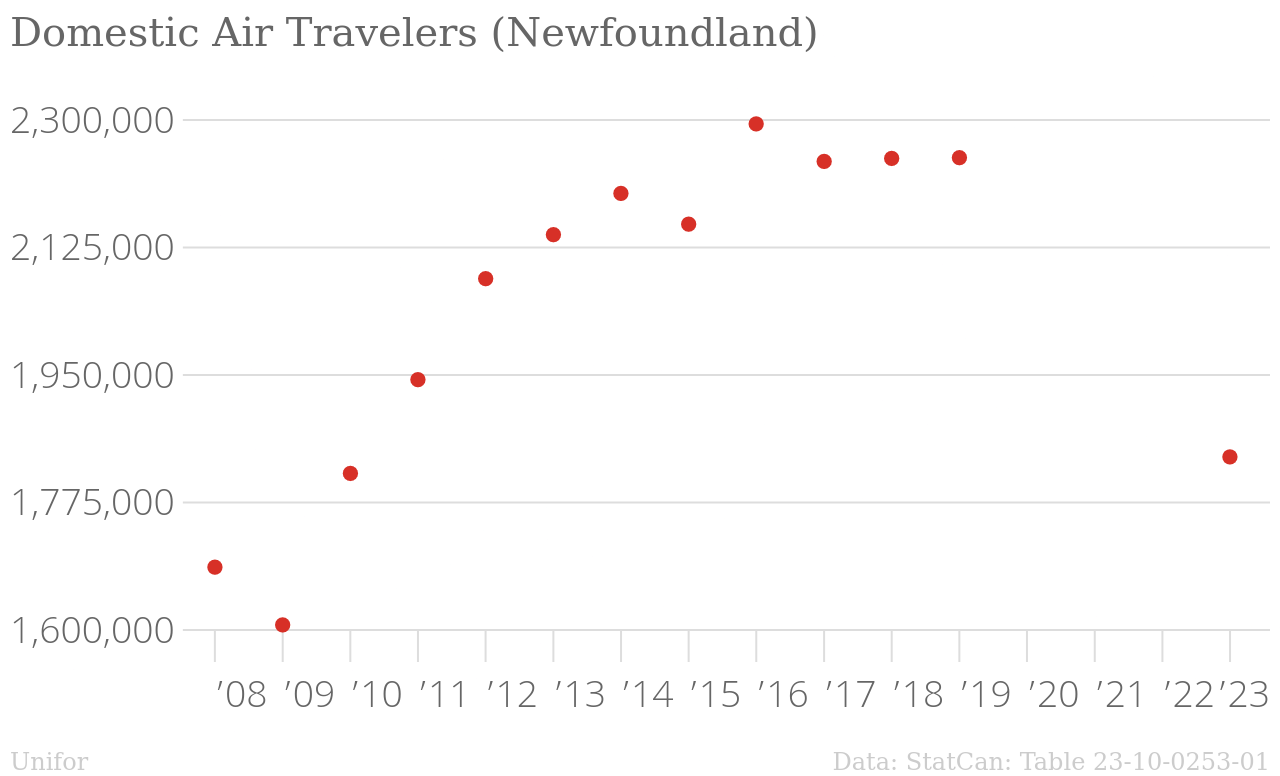
Access to personal air travel has increased substantially since 2000.
In 2016, the NL government Visitor Profile outlined that air travel was the preferred option for travel for 84% of travellers to the province (72% even for those vacationing). This compares with 67% who visited via air for vacation in 2011.
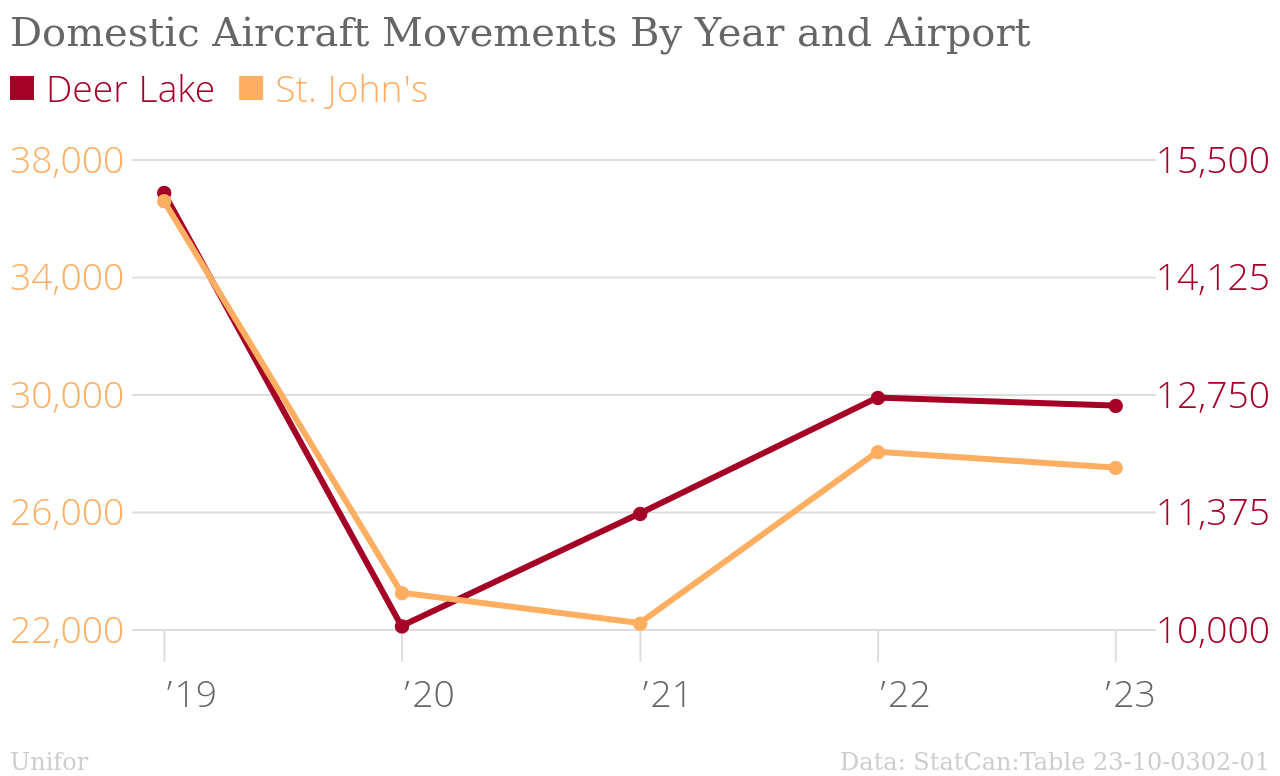
Air travel hit a peak in 2019 of over 50,000 domestic air craft operations in Newfoundland airports across the two busiest airports. Those trips are increasing back to pre-pandemic levels as fast as other airports in Canada.
Total airport passenger movements in 2023 was 1,837,629, up 16% since 2022 according to the department of Tourism, Culture, Arts and Recreation.
There are now many more airlines operating to and from Newfoundland including regular daily flights from:
- Porter
- Flair
- Air Canada
- WestJet
Regular return flights operate for less than $200 to $400 between Toronto and St. John's.
Marine Atlantic ferry passenger rates are:
- Return trip Argentia, NL – North Sydney, NS: $232.54
- Return trip Port aux Basques, NL – North Sydney, NS: $87.56
Compare this to:
- two hour whale watching tour in St. John's which will cost $115-$130.
The Marine Atlantic ferry should be and is less expensive, but prices for airline tickets are now closer than they were in 2000. This makes air travel more of an option given the prices people are already planning on spending on travel.
Freight to and from Newfoundland
Marine freight options
Marine freight to the island has expanded since the 2000s to include more modes of travel than Marine Atlantic.
These include:
- Continued and increased shipping from Oceanex from Montreal ports which accounts for 50% of the marines freight arriving on the island.
- MSC Mediterranean Shipping Company including Corner Brook on its large freight carrier routes from Montreal ports.
- Freight transport from several ports in Labrador via Nunatsiavut Marine Inc. and Labrador Marine Inc. shipping.
- International freight arriving via Saint Pierre and Miquelon.
Air freight
Air freight systems are in operation in Newfoundland.
- Air Canada Cargo
- Air Saint Pierre Cargo
- Cargojet
- FedEx
- Purolator Courier
- PAL Airlines Cargo
- Servisair
- WestJet Cargo
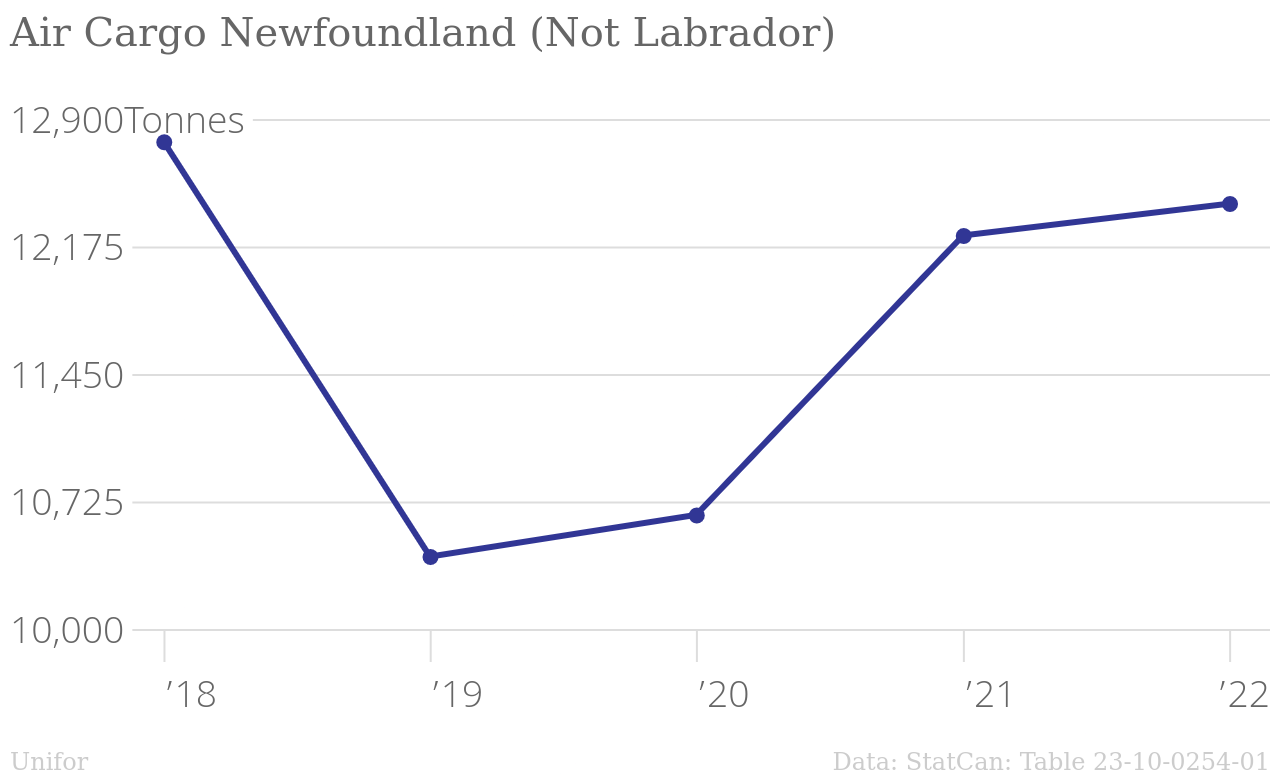
Air cargo freight has returned to pre-pandemic levels faster than passenger transport with nearly 12.5 Thousand Tonnes of air freight landing on the island in 2022.
Unifor Supply Chain Analysis (in progress)
- Review of federal supply chain submission and apply to Marine Atlantic shipping.
- Short-term supply chain disruptions and how they impact the local economy or access to goods/services.
- The Right to strike and CN's campaign against it.
- Anti-replacement workers legislation during disputes
- Employment recruitment and retention: comparisons with other workers in similar classifications.
- Safety of transport systems.
- Cost of living increases.
- Options during long disputes, including interest arbitration: how and when it should be accessed/requested.
- How best to determine and establish minimum essential service levels while still sustaining economic pressure on the employer to negotiate.
 Marine Road Rail